
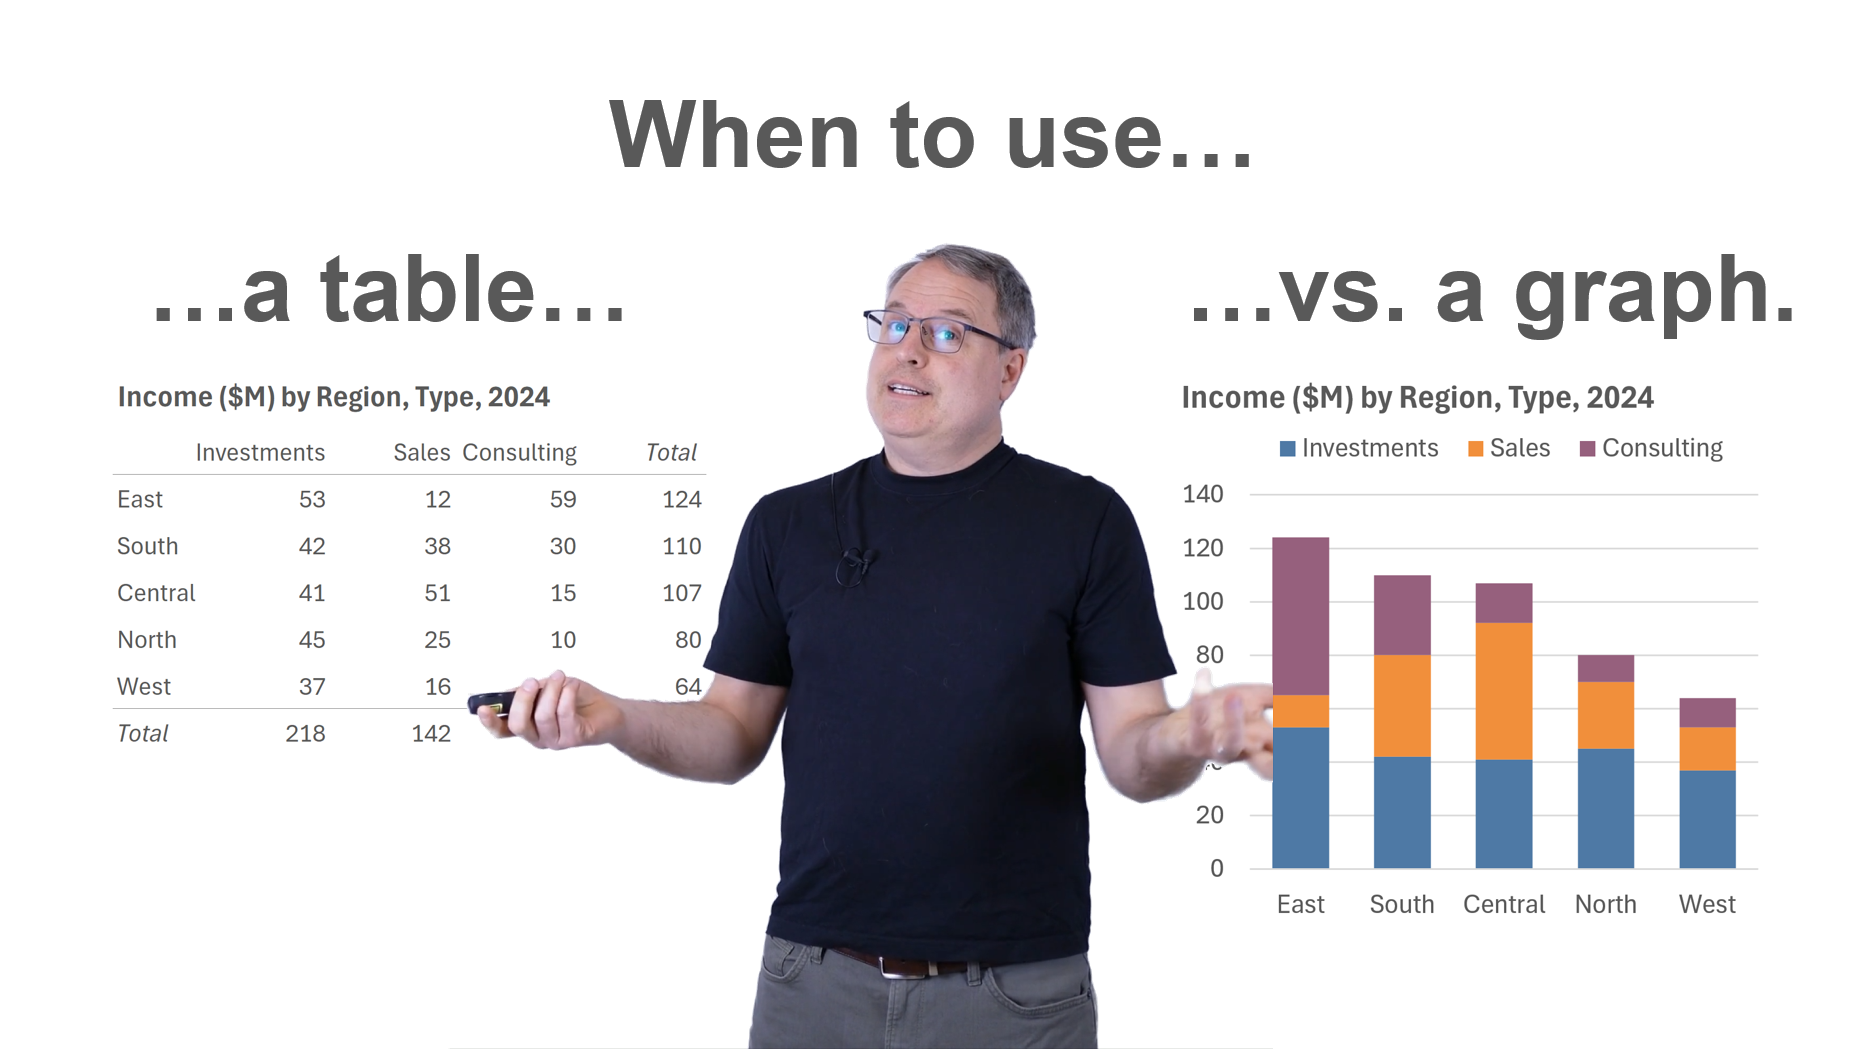
It's probably a lot less often that you think. In fact, there are just three specific—and quite rare—situations in which I'd show data as a table only (as opposed to a graph or a graph plus a table).
What are those three situations? Find out in my latest video (10 mins):
BTW, European friends:
I'll be in your neck of the woods in May and am looking to add one or two more workshops to my trip. Interested in an in-person dataviz and/or dashboard design workshop for your team, or in hosting an open-registration workshop in your city? Contact me for deets.